AI Native Operating Model · Part 7 of 7
In our value-stream assessments, we routinely see changes that require two or three days of engineering work take five or six months to reach production. Most of that time passes between stages, while the work waits for someone or something else. An agent that compresses three days of coding into an afternoon saves about two days out of a hundred and sixty.
That is the difficulty with measuring AI developer productivity. A team can produce code much faster while the organisation takes just as long to deliver a change. If its developer productivity metrics stop at generated code or merged pull requests, both the investment and the improvement programme can look successful while delivery barely moves.
In this final part of the AI Native Operating Model series, we propose measuring the whole path from intent to outcome, including the human decisions along it. That changes what teams should optimise: the amount of work waiting, the attention needed to make decisions, and the improvements each completed mission leaves behind.
What faster coding has delivered so far#
Faros AI's 2025 analysis covered more than 10,000 developers across 1,255 teams. It found gains at team level, but reported that "any correlation between AI adoption and key performance metrics evaporates at the company level".1 The gains stopped being visible when the data was aggregated across the organisation.
Its Q2 2026 report followed two years of telemetry from 22,000 developers across 4,000 teams. Comparing low and high AI adoption within the same organisations, it recorded 66% more epics completed, 34% higher task throughput and 16% more pull requests merged. Alongside that activity, bugs per developer rose 54% and monthly incidents rose 58%. Incidents per pull request increased 243%, code churn increased 861%, and median review time was five times longer. Deployments per week fell 12%.2
Six measures from Faros AI's Q2 2026 report, comparing low and high AI adoption within the same organisations. Three other figures would not fit the scale: incidents per pull request up 243%, code churn up 861%, and median review time five times longer. These are associations rather than controlled comparisons, the report does not define every baseline, and nothing here establishes that AI adoption caused the changes. Source: Faros AI, The Acceleration Whiplash, two years of telemetry from 22,000 developers across 4,000 teams.
More work was being completed and merged, yet deployments became less frequent. The increases in bugs, incidents and rework also show why activity alone is an inadequate measure of engineering productivity.
These are observational findings. They do not establish that AI caused the changes, and the report leaves some baselines undefined. Queueing theory nevertheless offers a way to investigate the pattern, particularly the fivefold increase in review time.
Follow the waiting work#
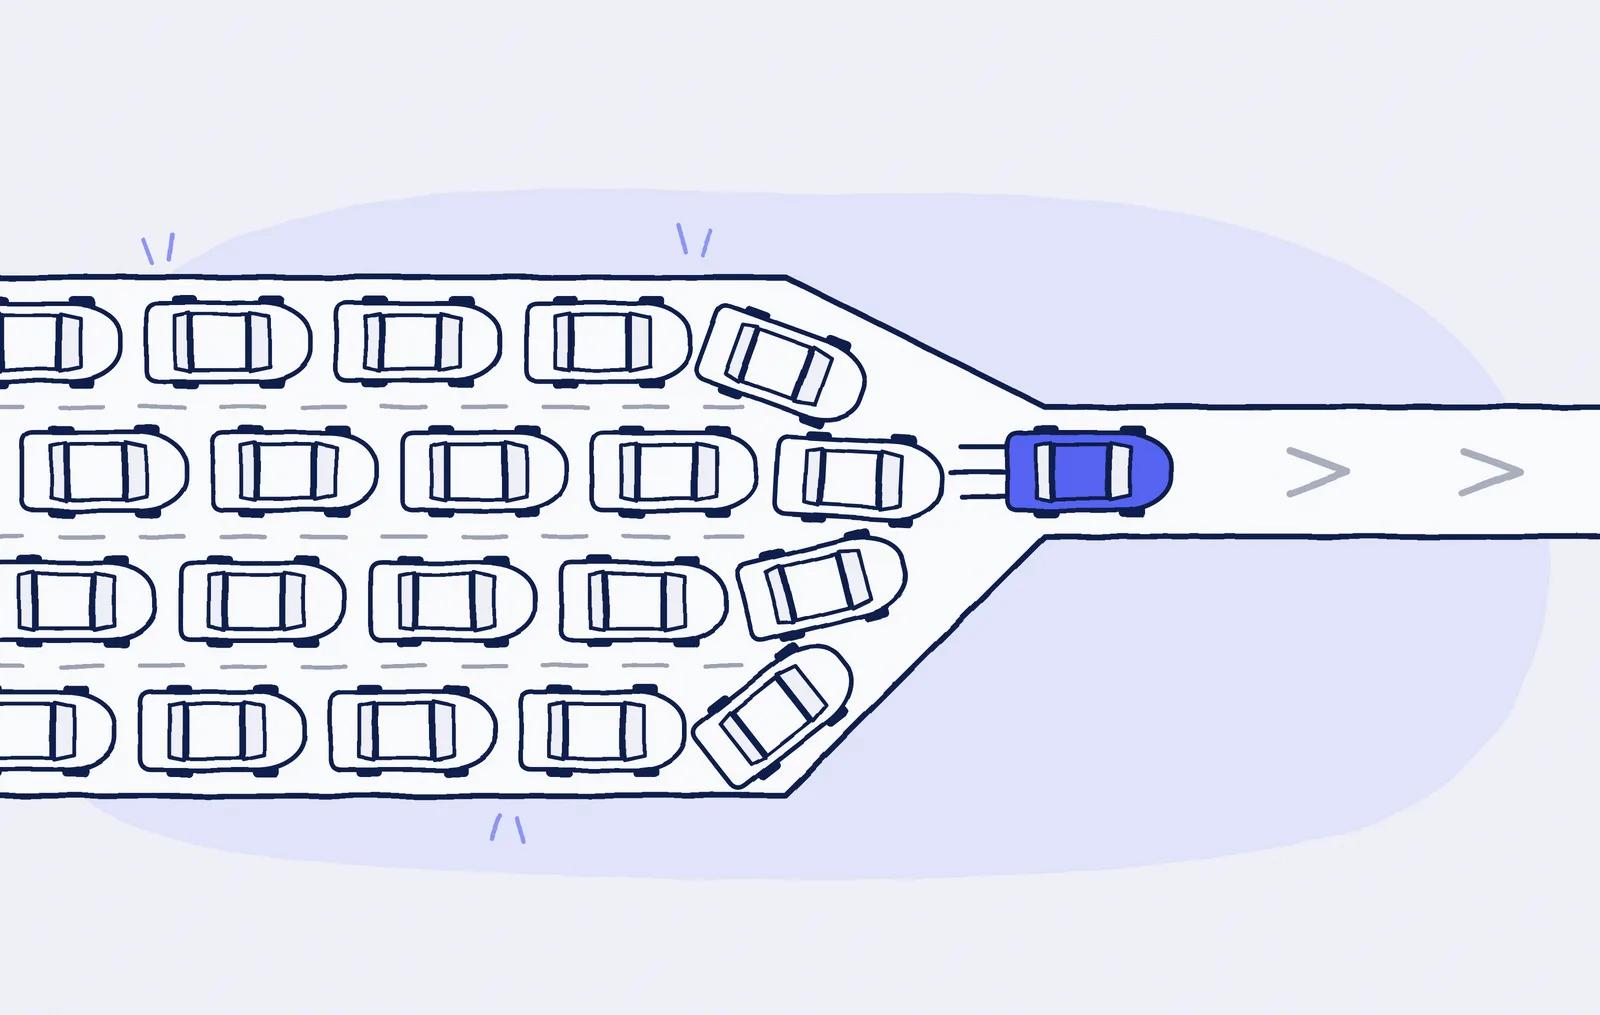
A delivery system can move only as fast as its constraint allows. In the theory of constraints, improving a stage that is already faster than the constraint produces inventory: work that is ready for the next stage but cannot yet pass through it.
With agents, that inventory can be code waiting for review. The generation step becomes faster, more changes arrive, and the people responsible for reviewing them have the same amount of time as before.
The effect gets worse as those reviewers approach full utilisation. Donald Reinertsen describes queues increasing exponentially with capacity utilisation, with wait time rising without bound as utilisation approaches 100%.3 A reviewer who is occupied 95% of the time has little spare capacity to absorb a difficult change or an uneven burst of arrivals.
This is why Reinertsen recommends controlling queue size instead of maximising utilisation. He also recommends reducing batch size before attacking bottlenecks. A team investigating its review queue should therefore examine both how much work arrives and how large each change is.
Faros's Q2 2026 report recorded a 51% increase in pull request size under high AI adoption. Larger changes were arriving more frequently at a queue whose capacity had not grown. Those conditions worsen together. Making generation faster again does not address any of them.
The human work inside the queue#
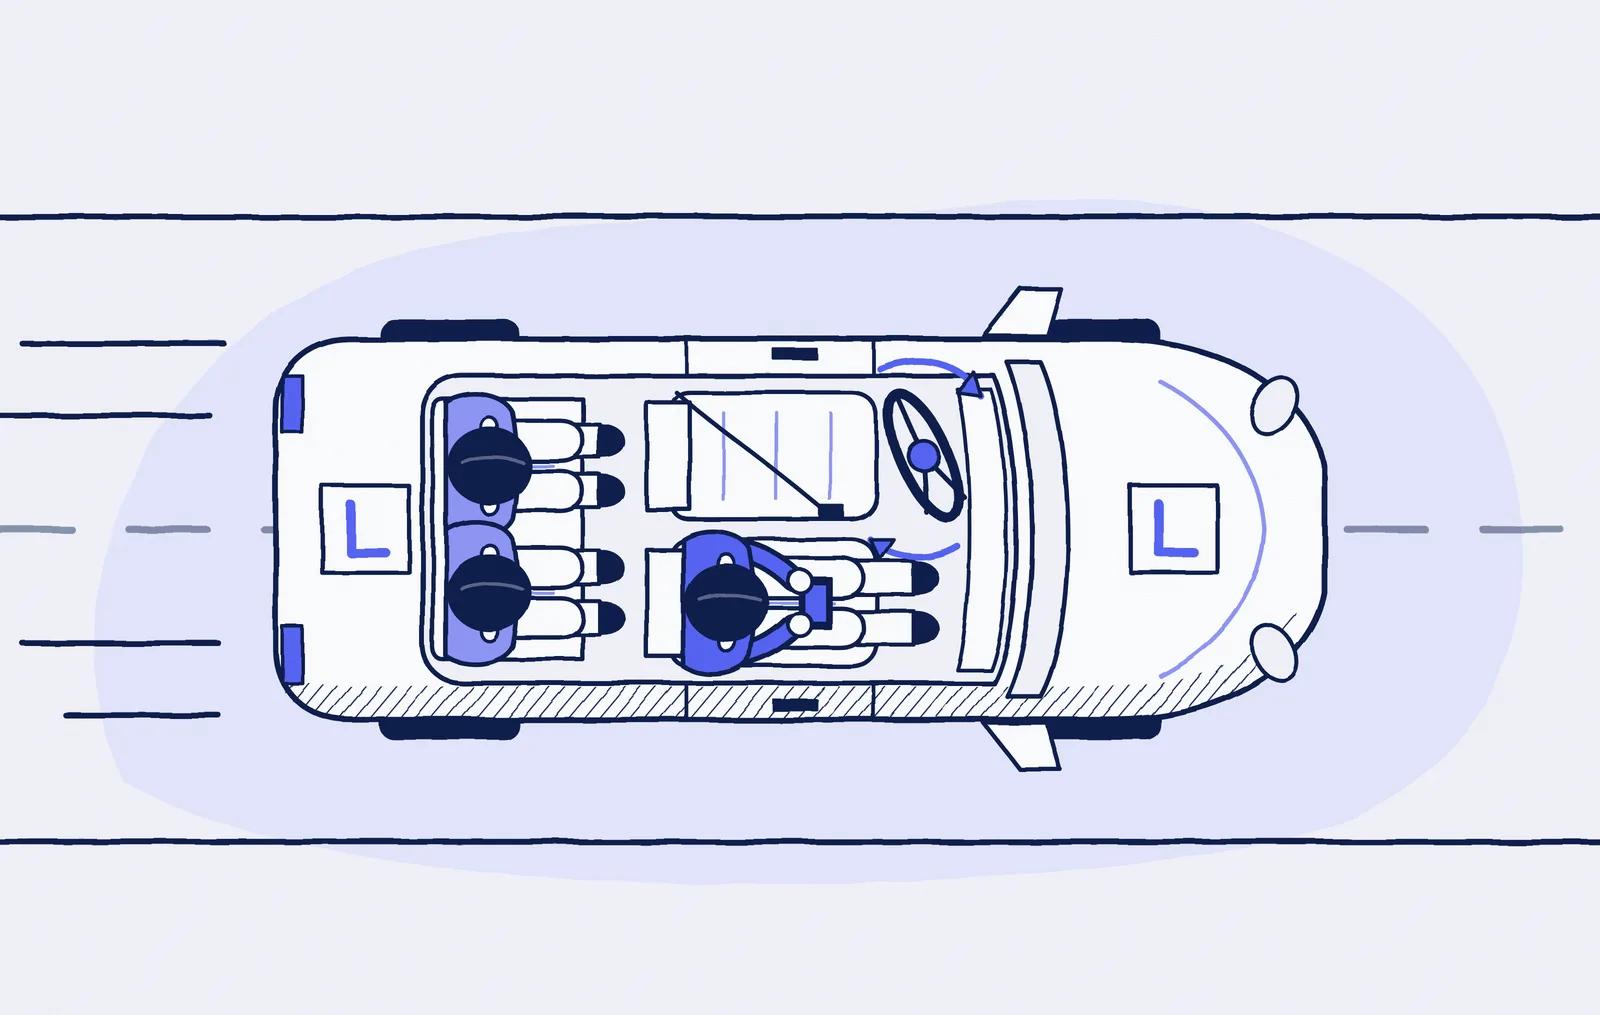
An agentic delivery system runs two optimisation loops through the same value stream.
In the machine loop, an agent loads context, acts, validates its work, records what happened and updates state. It also detects stale context and refreshes it. Better context, faster validation, fewer retries, cheaper models, clearer policy and greater autonomy can all improve this loop. The industry is investing heavily in it.
The human loop begins when someone returns to work they have not followed continuously. Before deciding, they need to understand what has changed, what evidence supports the proposed action and what risk they would accept. They then make the decision, record their reasoning and hand control back.
That return takes time even when the requested decision looks small. Decision-ready briefs, fewer clarification rounds and faster re-entry can reduce it. Removing unnecessary gates can eliminate some of it entirely.
The two loops operate at speeds that differ by orders of magnitude, but our instrumentation largely follows the machine. Agent observability products measure traces, tokens, latency, cost and evaluation quality. They leave out queue length, wait time, decisions sitting without an owner and the accountable senior attention consumed by an outcome.
Measuring AI productivity through the machine loop alone therefore misses the work most likely to limit delivery. It also encourages the throughput police pattern: teams optimise the activity their tools can see while the bottleneck elsewhere remains unresolved.
Decide which human gates to keep#
There are two levers for improving this flow. The first removes human gates. The second improves the decisions at the gates that remain.
Better context, deterministic checks, stronger validation, guardrails, policy engines, evaluations and fast rollback can make human intervention unnecessary at some points. Each gate removed eliminates a queue. The industry's investment in this work is justified.
Where a person is still needed, concentrate their involvement on intent, trade-offs and risk acceptance. Give them enough information to make those decisions quickly and independently. Comprehension engineering addresses this part of the system: how someone becomes ready to judge work they have not been following.
The levers depend on each other. As automated work passes through fewer human gates, accountability concentrates on the remaining decisions. An approval made without independent understanding leaves the organisation exposed, even if the workflow now contains fewer queues. Part five examined this failure in individual handoffs; removing more gates increases its significance.
Ben Green's survey of 41 policies requiring human oversight of government algorithms offers a warning. He concluded that the evidence suggests people are "unable to perform the desired oversight functions" and that such policies "provide a false sense of security" while legitimising faulty algorithms.4 His subject was government algorithms, so this is a warning for software delivery rather than a measured finding about it.
For delivery teams, the implication is to test whether a gate works. Can the person demonstrate readiness to decide? If they repeatedly cannot, examine whether the system is transferring the necessary information and whether the decision belongs at that point in the workflow.
A gate that cannot be shown to work needs redesign or removal. Keeping an approval step because its presence is reassuring does not resolve the oversight problem. Improving the remaining decisions is what makes further automation safer.
Three approaches to human review#
OpenAI, Stripe and StrongDM illustrate how differently organisations can answer this question. All three used agents extensively in 2026, but their arrangements for review differ.
OpenAI moved review towards agents#
OpenAI's Harness team built a repository of roughly a million lines in five months, with every line written by Codex. Over time, they "pushed almost all review effort towards being handled agent-to-agent". Humans may review pull requests, but are not required to.
The team names its constraint as "our one truly scarce resource: human time and attention". Its earlier practice of spending every Friday, a fifth of the working week, cleaning up AI slop did not scale.5 Moving review required investment in the surrounding system. The team warns that its end-to-end autonomy "depends heavily on the specific structure and tooling of this repository and should not be assumed to generalize without similar investment".
Stripe retained human review#
Stripe's Minions merge more than a thousand pull requests a week containing no human-written code. Every one receives human review before it lands.6 Stripe automated generation while keeping a person responsible for reviewing each change.
StrongDM prohibited human code review#
StrongDM's rules prohibit humans from both writing and reviewing code. Specifications and scenarios drive agents to converge without human review, with testing against behavioural clones of third-party services.7 Its token-spend benchmark is a minimum: if the team has not spent at least $1,000 on tokens per human engineer that day, its software factory has room for improvement.
These organisations build different products and accept different risks. Their examples describe mechanisms for organising delivery; they do not establish a universal review policy. Pull request volume and token spend alone establish neither autonomy nor return on investment.
Developer productivity metrics for the whole flow#
Our proposed engineering metrics start with a delivered outcome and work back through the system that produced it. They are a proposal for discussion, not a validated measurement standard.
Outcomes#
Measure how long it takes to turn intent into a useful outcome and what that outcome costs. Include compute and human time in the same currency. Alongside time and cost, record whether the acceptance conditions were met, the effect on the problem the mission addressed, reliability and residual risk.
These measures establish what the mission achieved. Activity counts can then help explain the result without standing in for it.
Flow#
Compare elapsed time with active time, and break waiting down by stage. Record work in progress, rework rate and validation cycles per outcome. Track the current constraint and where it was last quarter.
This makes it possible to distinguish slow execution from work that spends most of its life waiting. That distinction determines whether faster agents would shorten delivery at all.
Human and machine involvement#
Measure human attention per outcome in accountable senior minutes. Track decision wait time in the decision queue, and time to decision ready after someone returns to work they have been detached from.
Also record escalation frequency, distinguishing over-escalation from under-escalation, and policy or permission interventions. A system that repeatedly asks people to resolve unnecessary escalations consumes attention differently from one that fails to escalate consequential decisions. A single total hides that distinction.
Learning#
Track reuse of components, patterns and context, reductions in recurring failure classes, and time saved by accumulated internal work. These measures capture improvements that can benefit later missions.
Together, these measures complement DORA's four. They help explain why delivery performance changes and where an intervention might improve it.
Establish your own baseline#
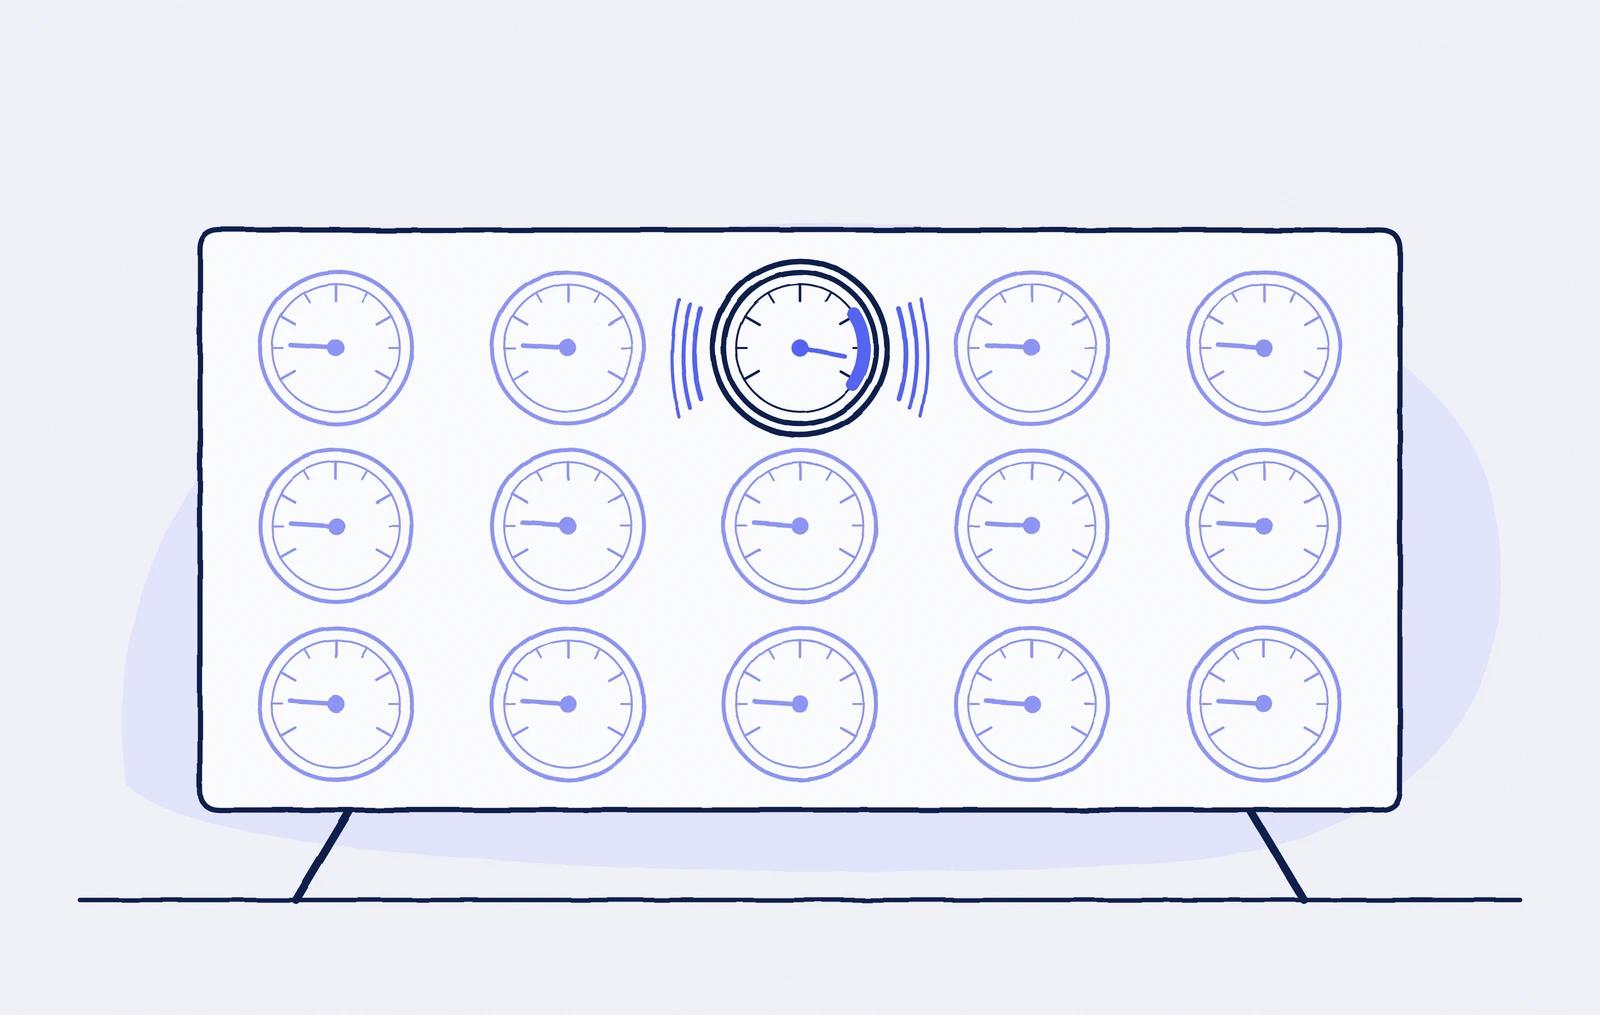
When measuring developer productivity, resist the appeal of a universal flow efficiency benchmark. The widely repeated claim that knowledge work operates at 5 to 15% flow efficiency has no traceable empirical source.
The only published dataset we could find was an agile coach's analysis of 63 teams at ASOS over twelve months. Flow efficiency ranged from 9% to 68%, averaging 35%. Addressing three benchmark claims circulating online, the author wrote that "none of these statements have any data to support the claims they make".8
One company in one sector over one year cannot establish a universal benchmark either. Measure your own flow and ask for the evidence behind any proposed comparison.
Use the measures to change the system#
Part one described how the constraint can move through skills and tooling, context, validation, comprehension, judgment, intent and organisational absorption. Each stage requires a different response, even though the visible symptom is often the same: work accumulating somewhere in the system.
The learn-and-adapt stage should move the constraint deliberately. Review it every few weeks, because the machine loop changes faster than a quarterly planning cycle.
Start with wait time by stage to locate the constraint as it exists today. Do not assume it is still where it was during the last review, or where your existing dashboard happens to measure.
Then choose an intervention that addresses the cause. Better context or validation may remove repeated clarification. Clearer policy may resolve recurring escalations. Cheaper reversibility may change which decisions need advance approval. Moving a decision right closer to the work may shorten a queue.
Adding capacity is another option, but senior human attention cannot be bought quickly. Before treating an overloaded reviewer as a staffing problem, examine the work reaching them and the information they receive.
After the intervention, measure the whole flow again. A new constraint is expected when the previous one stops limiting throughput. The context, validation and policy improvements should continue working, making each subsequent pass less costly.
Keep activity metrics in a diagnostic role#
Token volume, prompt count, generated lines, pull request count, agent count and automated task count can describe what the system is doing. They cannot tell you whether it is delivering better outcomes.
Agent utilisation is particularly easy to misread. High utilisation outside the constraint can indicate overproduction. Keeping agents busy sends more work towards the bottleneck; lead time can deteriorate while the activity dashboard improves.
Human utilisation has the same limitation. An engineer at 95% utilisation has little capacity left to absorb variability, while agents generate uneven arrivals continuously. The aim is to improve flow through the constraint, not to keep every resource fully occupied.
Recognise what the data cannot establish#
There is no independent, large-sample study measuring cost per delivered outcome for agentic coding. Published figures come from vendor methodologies or individual organisations. DORA's ROI calculator for AI adoption provides a structured estimate of potential return, rather than a measurement of realised return.9 A vendor quoting cost per outcome should be able to explain how it counted delivered outcomes.
Instrumentation also remains incomplete. OpenTelemetry's generative-AI semantic conventions cover agent spans but have development status, not stable status. Products built on them do not measure queues.
Four additional fields would cover the missing information: wait time per stage, queue depth per accountable owner, time to decision ready, and a post-decision flag recording whether the person was needed. No product ships those fields. Until those gaps are addressed, AI productivity metrics describe only part of the delivery system.
Make each mission improve the next#
A mission should leave the system better able to deliver subsequent work. That might mean a reusable component, a context update, a repeatable agent pattern, a validation improvement, a policy change, a comprehension artefact that worked, a reference architecture or a documented failure mode.
The control room makes those contributions visible. Activity metrics miss this work, even though its benefits accumulate across later missions.
The cycle is to observe, locate the constraint, change the system and measure the result. Update the factory, context, comprehension layer and governance with what was learned, then repeat.
What remains open#
This series proposes an operating model whose final shape is still uncertain. Evidence supports the finding that local AI productivity gains do not guarantee end-to-end throughput. Our argument is that human review cannot scale linearly with machine-generated activity, that machine-facing context and human-facing comprehension need different designs, and that greater autonomy increases the importance of explicit boundaries, evidence and escalation.
Several further ideas remain hypotheses: hybrid mission teams becoming the dominant unit; human roles resolving into classes of judgment; a comprehension layer becoming a distinct technical component; decision queues becoming a primary interface; and human attention per outcome becoming a standard metric.
We do not know the final team topology. We do not claim that comprehension can be reduced to a score, that this architecture will become a standard, or that a dark factory is inevitable.
There are also ways to test the argument. An organisation that substantially increased agent throughput and saw lead time fall proportionally without restructuring the surrounding system would falsify our central claim. A controlled comparison finding that decision briefs made no difference to decision quality or speed would remove the case for the second lever. If human attention per outcome stayed flat as autonomy rose, we would need to look elsewhere for the constraint.
For a team deciding what to improve now, begin with work already in progress. Find where it waits, what is needed to move it forward and whether the person involved needs to be there. Use the delivered outcome to judge the intervention, and carry what you learn into the next mission.
Sources and further reading#
- Faros AI, "AI software engineering", July 2025, reflecting analysis as of June 2025. Telemetry from over 10,000 developers across 1,255 teams, comparing each team's lowest and highest AI-adoption quarters. ↩
- Faros AI, "The Acceleration Whiplash", AI Engineering Report Q2 2026. Two years of telemetry from 22,000 developers across 4,000 teams, comparing outcomes at low versus high AI adoption within the same organisations. These are associations rather than controlled comparisons, and the report does not define every baseline. ↩
- Donald Reinertsen, The Principles of Product Development Flow, pp. 59, 75 and 133. ↩
- Ben Green, "The Flaws of Policies Requiring Human Oversight of Government Algorithms", Computer Law & Security Review, 2022. A survey of 41 policies. Green's conclusion is hedged — that the evidence suggests people are unable to perform the desired oversight functions — and his subject is government algorithms rather than software delivery. ↩
- OpenAI, "Harness engineering: leveraging Codex in an agent-first world", 11 February 2026. ↩
- Stripe, "Minions: Stripe's one-shot end-to-end coding agents", 9 February 2026. ↩
- StrongDM's "Software Factories and the Agentic Moment", as quoted and examined in Simon Willison, "How StrongDM's AI team build serious software without even looking at the code", 7 February 2026. The rules and the token figure are StrongDM's; the scepticism is Willison's. ↩
- "Our survey says: uncovering the real numbers behind flow efficiency", ASOS Tech Blog, by Nick, an agile coach at ASOS. The quoted sentence responds to three specific benchmark claims rather than to all of them. ↩
- DORA, AI ROI, 2026. We describe it as a structured estimate because that is what the published material supports; the underlying assumptions are in the full report rather than on the calculator page. ↩
Background: Eliyahu Goldratt's theory of constraints, paraphrased rather than quoted, for the claim that system throughput is set by the constraint.
Previously in the series: Managing the System That Does the Work
The series: Towards an AI Native Operating Model · The Hybrid Team · The Delegation Boundary · The AI Native Control Room · Human in the Loop Is Not a Design · Managing the System That Does the Work
Related: What is a software factory? · Comprehension engineering · What AI native means
We run value-stream assessments to measure wait time by stage and locate constraints in hybrid delivery. If you want to understand where work is getting stuck in your organisation, contact info@re-cinq.com.