What are DORA metrics?

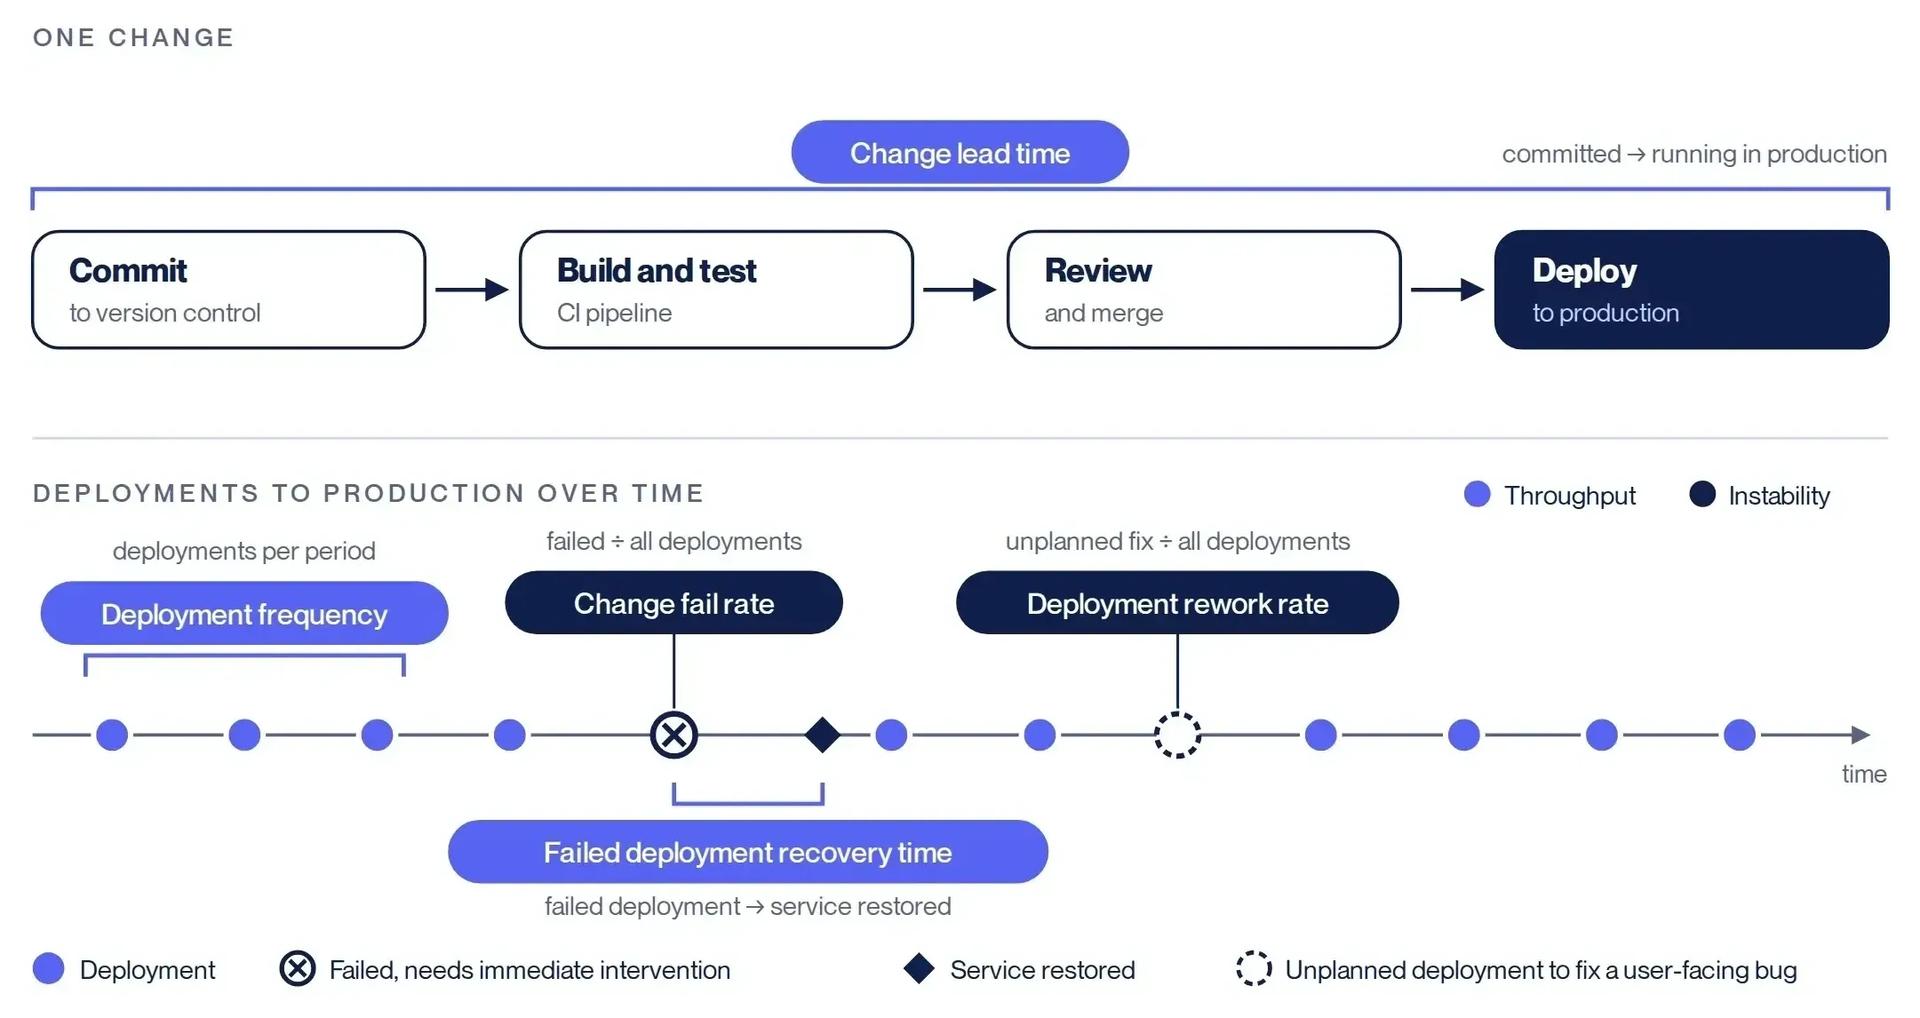
DORA metrics are five measures of software delivery performance, defined by DORA (DevOps Research and Assessment), the research programme now run at Google Cloud. Change lead time, deployment frequency and failed deployment recovery time describe throughput. Change fail rate and deployment rework rate describe instability. Together they show how quickly and how safely changes reach users, tracked for one application or service over time.
There are five of them now, and the set has moved twice in three years. Mean time to recover was redefined as failed deployment recovery time in 2023, deployment rework rate joined the set after DORA's 2024 research, and the 2025 report replaced the familiar elite, high, medium and low tiers with seven team profiles. Much of what ranks for the term still describes the 2019 version, so this guide works from DORA's own current definitions and dates every benchmark it quotes.
If you came for the AI part, it starts at What AI is doing to DORA metrics. The two sections before it define the five metrics first, because DORA states its AI findings in terms of them. The rest of the guide is benchmarks, measurement, pitfalls and improvement.
What are DORA metrics?#
DORA stands for DevOps Research and Assessment. Its research began with the 2014 State of DevOps study, led by Nicole Forsgren with Jez Humble and Gene Kim, and DORA joined Google Cloud in December 2018. Its findings come from a survey of technology professionals run most years, analysed statistically to find which capabilities predict better delivery. Per DORA's current guide, there are five metrics in two groups:
| Metric | DORA's definition | Group |
|---|---|---|
| Change lead time | "The amount of time it takes for a change to go from committed to version control to deployed in production." | Throughput |
| Deployment frequency | "The number of deployments over a given period or the time between deployments." | Throughput |
| Failed deployment recovery time | "The time it takes to recover from a deployment that fails and requires immediate intervention." | Throughput |
| Change fail rate | "The ratio of deployments that require immediate intervention following a deployment," likely resulting in a rollback or a hotfix. | Instability |
| Deployment rework rate | "The ratio of deployments that are unplanned but happen as a result of an incident in production." | Instability |
Source: DORA, "DORA's software delivery performance metrics", updated 5 January 2026. DORA's reports use "change failure rate" and the guide uses "change fail rate"; they are the same metric.
Since the 2024 report, recovery time sits with the throughput metrics, which surprises readers who learned it as a stability measure. The grouping matters when reading DORA's findings, because statements such as "AI adoption improves throughput but increases instability" refer to these exact bundles.
The metrics are "meant to be applied at the application or service level," in DORA's words, so a number for a whole engineering department is an average of very different systems. And they describe teams: DORA's guidance on empowering delivery teams is blunt that "software delivery performance is not an individual measure; it measures your ability to change and update an application, and this can only be done by teams."
Speed and stability are not a trade-off: DORA's guide reports that the metrics are correlated for most teams, and that "top performers do well across all five metrics, and low performers do poorly."
The five DORA metrics explained#
Each one below gets the same treatment: what it tells you, the trap that most often makes the number misleading, and what moves it.
1. Change lead time
The time from a change being committed to version control to that change running in production. It shows how long finished work waits before users can benefit.
The trap. Tools disagree about when the clock starts. GitLab's built-in metric measures from merge request merge to production, leaving out review time; some practitioners widen the window instead, measuring from problem discovery. Either is legitimate if the team states it and keeps it stable.
What moves it. Small batches, trunk-based development, fast code review, test and deployment automation, fewer handoffs. Booking.com's Egor Savochkin documented one team whose lead time improved only once merge request approval time fell from 17.1 hours to 8 minutes.
2. Deployment frequency
How often a team deploys to production. It is a proxy for batch size: teams that deploy often are usually shipping smaller changes, which are easier to review, test and roll back.
The trap. Counting deployments to any environment inflates the number; DORA counts production. It is also the easiest metric to game, by splitting releases without changing how work flows.
What moves it. Deployment automation, loosely coupled architecture, smaller changes, and ways to separate deployment from release.
3. Failed deployment recovery time
The time to recover from a deployment that fails and needs immediate intervention. It replaced mean time to recover in 2023 because, per DORA's history of the metrics, the older definition "did not distinguish between a failure initiated by a software change and a failure caused by external factors". The new metric covers failures your own changes cause, which are the ones your delivery practices can prevent.
The trap. Calling it MTTR and feeding it every incident, including outages with no deployment behind them, reverts to the definition DORA abandoned. Averages mislead here too, because one long outage can dominate a quarter.
What moves it. Rehearsed rollback, progressive delivery, feature flags, observability, and small changes that are quick to diagnose.
4. Change fail rate
The share of deployments that need immediate intervention, calculated as failed deployments divided by total deployments.
The trap. Most errors come from the definition of failure. As Thoughtworks noted in 2022, "CD pipeline data alone doesn't provide enough information to determine what a deployment failure with real user impact is."
What moves it. Test automation the team trusts, smaller changes, review that catches the right things, and continuous integration that runs before merge.
5. Deployment rework rate
The share of deployments that are unplanned and happen because of an incident in production. It was first measured in 2024, and DORA's 2025 year in review confirmed it has "officially evolved the four software delivery performance metrics into five metrics".
How it differs from change fail rate. Change fail rate counts deployments that break badly enough to need immediate intervention. Rework rate counts unplanned deployments made to fix problems users found, whether or not the original change triggered an emergency.
Why it matters now. When code volume rises faster than review and testing capacity, rework rate is often where the cost shows first. Thoughtworks' April 2026 Radar says degradation in the stability metrics, rework rate above all, is "an early warning sign of blind spots, technical debt and the risks of unchecked AI-assisted development" (Technology Radar vol. 34).
What AI is doing to DORA metrics#
AI coding tools change the input to the delivery system: more code, arriving faster. The DORA metrics measure what comes out the other end, which makes them a natural way to test claims about AI productivity. The 2024 report found that 75.9% of respondents relied on AI for at least part of their work, and that adoption was associated with worse delivery: for every 25% increase in adoption, "an estimated decrease in delivery throughput by 1.5%, and an estimated reduction in delivery stability by 7.2%". DORA's leading hypothesis was batch size: the report judged it "possible, even likely, that changelists are growing in size", and larger changes have consistently proved slower and less stable.
A year on, the 2025 report found that 90% of respondents used AI at work and observed "a positive relationship between AI adoption on both software delivery throughput and product performance … However, AI adoption does continue to have a negative relationship with software delivery stability." Its central conclusion is the one engineering leaders quote most: "AI doesn't fix a team; it amplifies what's already there."
The productivity paradox
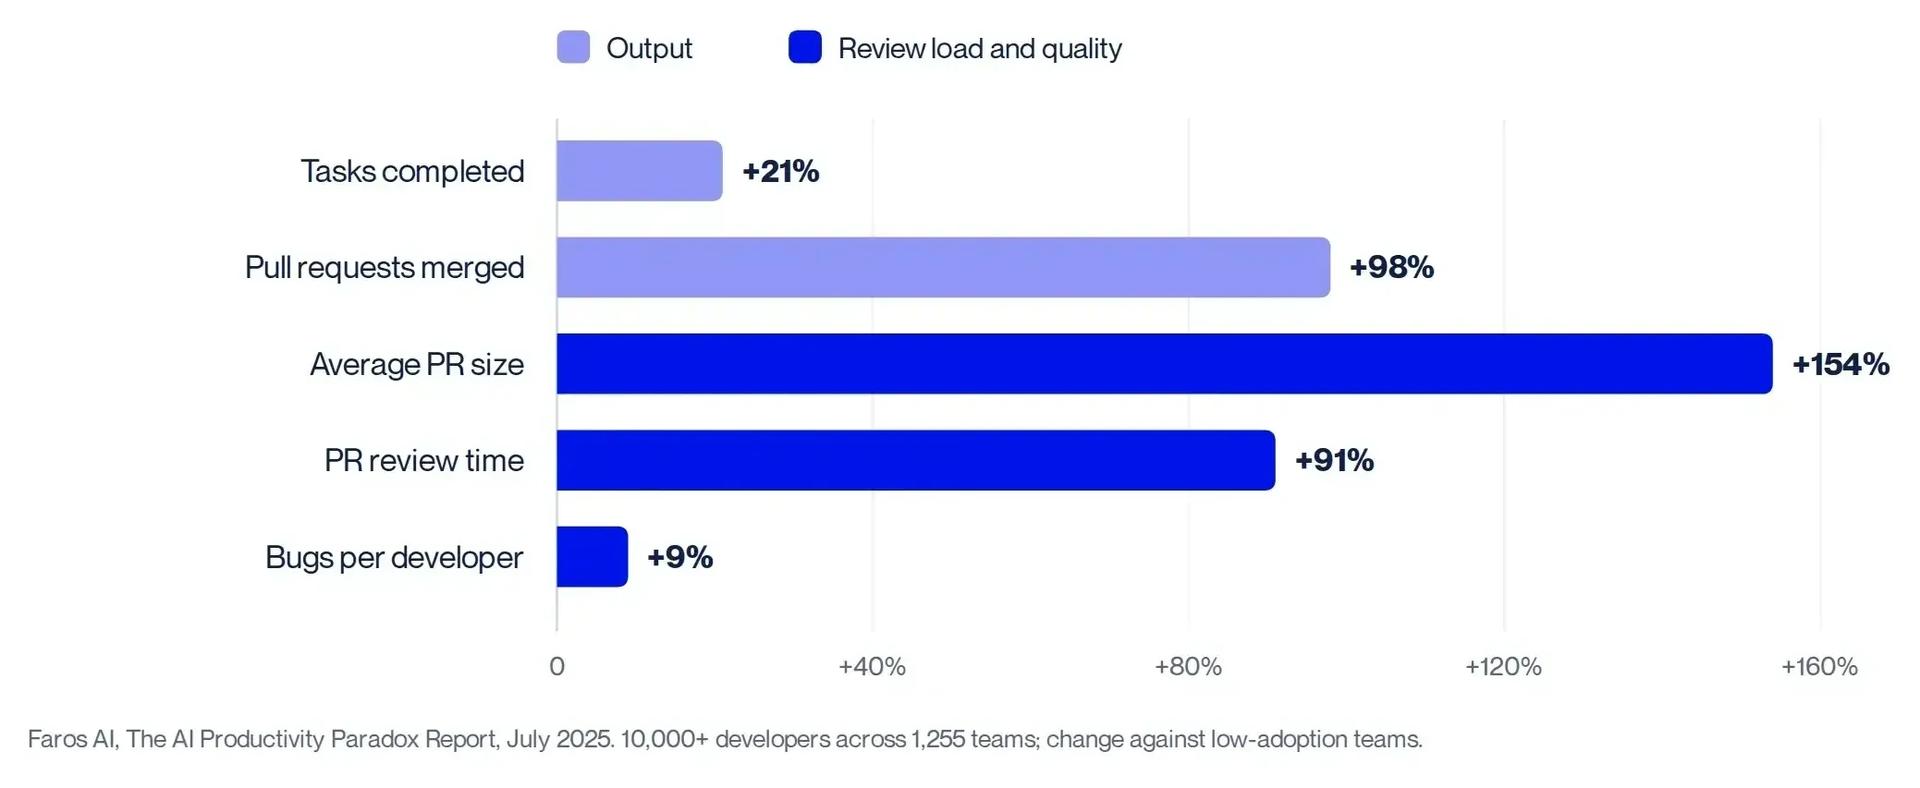
Faros AI's AI Productivity Paradox report (July 2025), covering over 10,000 developers across 1,255 teams, found that developers on teams with high AI adoption completed 21% more tasks and merged 98% more pull requests, while review time rose 91%, average PR size rose 154% and bugs per developer rose 9%. Across throughput, DORA metrics and quality measures, Faros found "no significant correlation between AI adoption and improvements at the company level."
Developers are also poor judges of their own speed. In METR's randomised trial, experienced open-source developers took 19% longer to complete issues in their own repositories when allowed to use AI tools, while believing afterwards that AI had sped them up by 20%. METR's 2026 follow-up considers it likely that current tools do better, on evidence it calls weak. Self-reported speed is a poor substitute for delivery data.
Why the gains stall downstream
When writing code gets faster, the constraint shifts to whatever comes next: review, testing, integration, release or product decisions. We describe this as the bottleneck moving. Elliott Beaty described a 250% increase in engineering velocity at Fruition, after which "the product team was caught on the back foot for three to four months" and QA needed significant hiring to catch up. DORA's March 2026 insight on balancing AI tensions names the cost as a verification tax: "The time saved during initial code or content generation is often re-allocated to verification overhead and prompting overhead." Rob Edwards put the operational version on our podcast: "if code review is your problem, generating more code is gonna make that even worse because there's even more PRs … to go and review."
Read together, the five metrics show all of this. Lead time that does not fall while pull request volume climbs points to a queue, and a rising rework rate alongside a steady change fail rate points to defects reaching users without breaking a deployment. Thoughtworks put the test plainly in its April 2026 Radar: "If lead times don't decrease and deployment frequency doesn't increase, faster code generation doesn't translate into better outcomes."
None of this is inevitable. When we moved Odevo's roughly 100 developers to agentic coding, a pilot cohort of about 20% of the engineers went first, and six weeks after training its pull request throughput was up 87% with PR size down 42%. Smaller changes and more of them is the opposite of the trend in Faros' data. Our reading is that a foundation module setting a shared baseline of practice did most of that work. These are pull-request measures from one organisation rather than a full DORA baseline.
The DORA AI Capabilities Model
DORA's 2025 research identified seven capabilities that amplify the benefits of AI. The list reads as a guide to where the gains get lost. Measured against our own AI Adoption Ladder, most organisations we see sit around stage 2: wide individual adoption without coordination, where usage dashboards look healthy and the DORA metrics have not moved.
| Capability | What DORA means by it |
|---|---|
| Clear and communicated AI stance | The organisation's position on AI-assisted tools is clear and well communicated |
| Healthy data ecosystems | The quality of internal data is high enough for AI to use |
| AI-accessible internal data | AI tools are connected to internal data sources, which boosts individual effectiveness and code quality |
| Strong version control practices | More important with the volume and velocity of AI-generated code |
| Working in small batches | A long-standing DORA principle, "especially powerful in an AI-assisted environment" |
| User-centric focus | A deep focus on the end user's experience |
| Quality internal platforms | Shared capabilities that scale the benefits of AI across the organisation |
Source: Storer and DeBellis, "Introducing DORA's inaugural AI Capabilities Model", Google Cloud, 23 September 2025.
What to track alongside DORA during an AI rollout#
Boards are asking whether the AI investment is paying off. Rob Edwards answers with another question: "Well, what are you trying to measure?" The DORA metrics are the right outcome measures for the delivery part, but too slow and too coarse on their own to steer a rollout week by week.
Start by dropping the easiest numbers to collect. Licence counts, active users, tokens consumed, lines of code and raw pull request counts all measure input or activity, and AI inflates every one. DORA's March 2026 guidance is direct: "AI can easily inflate the volume of code generated; therefore, leaders must stop relying on such narrow, output-based metrics as a measure of actual productivity." Pini Reznik makes the same point about adoption dashboards in Why AI Adoption Is a Leadership Problem: whether people are using AI is the wrong question, and whether you are delivering more than before is the useful one.
| Signal to watch weekly | Why it matters with AI | Evidence |
|---|---|---|
| PR size (batch size) | The mechanism DORA suspects behind AI's stability cost; the earliest warning that changes are growing | DORA 2024 report; Faros (+154% PR size); Odevo (−42% with deliberate practice) |
| Time waiting for review | Where extra code queues first; drives lead time | Faros (+91% review time); DORA's verification tax |
| Time in each stage of the value stream | Shows which constraint AI has exposed: review, QA, integration, release or product | DORA 2025 on value stream management; Fruition |
| Deployment rework rate (already one of the five) | Of the five, the one that moves first in a rollout: it catches defects that reach users without breaking a deployment | Thoughtworks April 2026 on rework as an early warning |
| Work outside normal hours | A burnout signal as expectations rise with AI | Multitudes research (+19.6% out-of-hours commits) |
The last row is the one most teams skip. On our podcast, Lauren Peate of Multitudes described research across four companies and over 500 developers in which developers made 19.6% more commits outside their typical working hours after AI tools arrived. Leaders she discussed it with assumed AI had made coding fun; her interviews pointed to delivery pressure.
Her advice on method was experimental: state a hypothesis, choose the metrics that would show whether it is working, and "do one experiment at a time." DORA's 2026 report on the return on AI-assisted development adds a warning about timing. Expect a temporary dip before the gains. InfoQ's summary attributes it to the learning curve as teams adapt, the extra review load on AI-generated code, and the need to adjust downstream processes. A baseline taken before the rollout is what lets a team tell that dip from a real decline.
DORA metrics benchmarks: what does good look like?#
Benchmarks are the most searched and most misquoted part of DORA's work. Many tables online combine thresholds from different years, and some contain bands that appear in no DORA report. The correct answer has two parts: the last four-tier table DORA published, from 2024, and the per-metric distributions from 2025.
| Level | Change lead time | Deployment frequency | Change fail rate | Failed deployment recovery time | Share |
|---|---|---|---|---|---|
| Elite | Less than one day | On demand (multiple deploys per day) | 5% | Less than one hour | 19% |
| High | One day to one week | Once per day to once per week | 20% | Less than one day | 22% |
| Medium | One week to one month | Once per week to once per month | 10% | Less than one day | 35% |
| Low | One to six months | Once per month to once every six months | 40% | One week to one month | 25% |
Source: DORA, 2024 Accelerate State of DevOps report. Shares are of survey respondents.
The medium cluster reported a lower change fail rate (10%) than the high cluster (20%), which catches most readers out. DORA's explanation is that the medium cluster is simply one where "throughput is lower and stability is higher." The tiers describe typical combinations, and a team can be ahead on one group and behind on the other.
The 2025 report published how its nearly 5,000 respondents answered each question instead. These are the most current figures DORA has released.
| Metric | Best buckets | Middle | Slowest or worst buckets |
|---|---|---|---|
| Change lead time | Under 1 hour 9.4% · under 1 day 15.0% | 1 day–1 week 31.9% · 1 week–1 month 28.3% | 1–6 months 13.2% · over 6 months 2.0% |
| Deployment frequency | On demand 16.2% · hourly to daily 6.5% | Daily to weekly 21.9% · weekly to monthly 31.5% | Monthly to six-monthly 20.3% · less often 3.6% |
| Failed deployment recovery time | Under 1 hour 21.3% · under 1 day 35.3% | 1 day–1 week 28.0% | 1 week–1 month 9.4% · 1–6 months 4.9% · over 6 months 1.0% |
| Change fail rate | 0–2% 8.5% · 2–4% 8.1% | 4–8% 19.6% · 8–16% 26.0% | 16–32% 19.5% · 32–64% 12.5% · over 64% 5.9% |
Source: DORA, State of AI-assisted Software Development 2025. Percentages are shares of respondents.
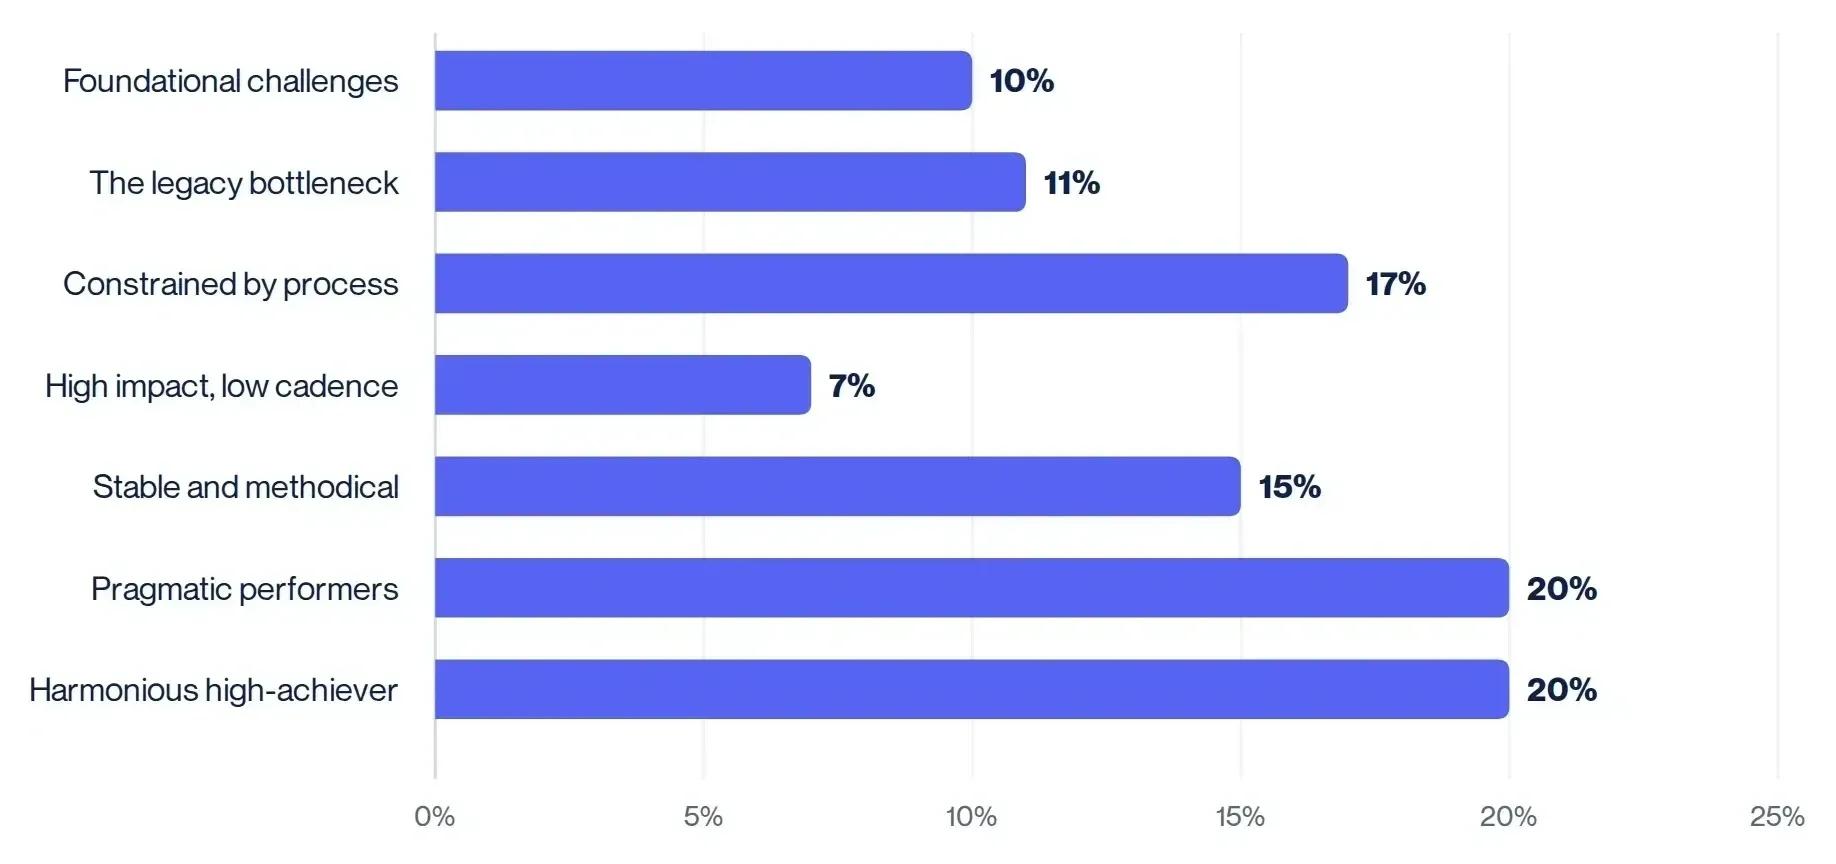
Instead of tiers, the 2025 report grouped teams into seven profiles across eight measures. "Constrained by process" (17%), teams on stable systems whose "effort is consumed by inefficient processes, leading to high burnout and low impact", is the clearest example of a pattern no four-number dashboard shows.
DORA's data comes from surveys, so the findings are associations rather than causes; Jez Humble and Nicole Forsgren, responding to a critique of Accelerate, accepted that they can use words like "drives" and "predicts" "but not 'causes' since we're not performing a randomized, controlled experiment." And DORA's 2023 advice still holds: "The most important comparisons are from looking at the same application over time, not by looking at other applications, organizations, or industries."
How to measure DORA metrics#
Most of the work in measuring DORA metrics is agreeing definitions. The data usually already exists; the disagreements are over what counts, and they decide whether the numbers mean anything.
| Metric | Clock starts | Clock stops or unit | Decide in advance |
|---|---|---|---|
| Change lead time | Commit to version control | Change running in production | Commit or merge as the start; median per service; how to treat long-lived branches |
| Deployment frequency | — | Successful production deployments per period | Whether partial rollouts, config changes and pull-based deploys count |
| Failed deployment recovery time | Failed deployment | Service restored | How incidents are linked to deployments; exclude failures with other causes |
| Change fail rate | — | Failed deployments ÷ all deployments | What "immediate intervention" means for this service |
| Deployment rework rate | — | Unplanned deployments ÷ all deployments | How deployments are marked planned or unplanned |
Compiled from DORA's metric definitions and the implementation notes in GitLab's and Google's Four Keys documentation. The data usually sits in Git history, CI/CD records and incident tooling. Record whatever you decide next to the dashboard.
Start small. DORA's guide warns that "building integrations to multiple systems to get precise data about your software delivery performance might not be worth the initial investment," and suggests starting with conversations, the Quick Check, or a product with pre-built integrations.
Read trends over time. Weekly numbers are noisy. In an InfoQ article, Booking.com's Egor Savochkin recommends process behaviour charts to separate real shifts from routine variation, and three to six months of baseline before drawing conclusions. One lead-time spike his team investigated turned out to be failing deployment tooling.
Tooling. Options run from open-source platforms such as Apache DevLake, to the DORA views built into GitLab and Harness, to engineering intelligence products that add surveys. They define each metric differently, so check before comparing numbers across tools.
Common mistakes with DORA metrics#
The most common complaint is that the metrics tell you what is happening without telling you why. A Reddit thread ranking for "dora metrics" opens with "Found out DORA metrics don't tell you WHY you're slow." The complaint is fair, and DORA anticipates most of the failure modes.
| Pitfall | What it looks like | What to do instead |
|---|---|---|
| Setting metrics as a goal | A mandate such as "every application must deploy multiple times per day by year's end," which DORA warns "increases the likelihood that teams will try to game the metrics" | Set goals on the constraint you are removing and use the metrics to check the effect |
| One metric to rule them all | Chasing deployment frequency while change fail rate and rework rise | Read throughput and instability together; treat the instability metrics as guardrails |
| Competing and comparing | League tables of teams; ranking a mainframe team against a web team | DORA: "improve your team's performance over time, not to compete against other teams or organizations" |
| Speed without guardrails | Faster delivery paid for out of quality | Bryan Finster's rule: "Measuring deployment frequency without using quality metrics as guardrails will result in poor outcomes" |
Adapted from the seven pitfalls in DORA's metrics guide. Finster quote from Abi Noda's summary of Finster's paper How to Misuse and Abuse DORA Metrics.
Behind most of these sits Goodhart's law: when a measure becomes a target, it ceases to be a good measure. DORA applied it to the AI era in a June 2026 piece on "tokenmaxxing", ranking engineers by token consumption, which it calls "incredibly easy to game".
Begin from the improvement and let the metric follow. Rob Edwards, who co-authored DORA's guide to value stream mapping, described the shift, speaking for himself, on our Waves of Innovation podcast: most people "come to DORA around the metrics," but starting there "doesn't … help the problem." Better to start by trying to improve things "and then use the metrics as a … guide for how things are being improved."
How to improve DORA metrics#
DORA's research model runs from capabilities, to delivery performance, to organisational outcomes, with the metrics in the middle. Teams improve them by changing how work is batched, tested, reviewed and deployed, then checking that the metrics moved. In DORA's recent research the biggest levers are value stream management, small batches and internal platforms.
Value stream management. The 2025 report describes this practice, "visualizing, analyzing, and improving the flow of work from idea to customer," as a force multiplier for AI. Edwards' method: agree a start and an end point, write down every step in between, estimate how long each takes and how long work waits between them, and get people from different parts of the organisation in the room. He named one precondition: "There is an element of psychological safety needed for some of these exercises."
Small batches. One of DORA's oldest findings and one of the seven AI capabilities. Smaller changes move faster through review and deployment, fail less often and are easier to recover from. Batch size is also where AI puts the most pressure, because generating a large change now costs almost nothing. The bottleneck moves rather than disappearing, and each improvement reveals the next one.
Internal platforms. DORA's 2024 report associated an internal developer platform with individuals 8% more productive and teams performing 10% better, alongside decreases of 8% in throughput and 14% in change stability, so a platform brings no automatic gain. By 2025, DORA reported "a direct correlation between a high quality internal platform and an organization's ability to unlock the value of AI." Our pattern cards describe the two outcomes as CN08, Platform Engineering, and AP25, Platform as Bottleneck: the same investment either speeds every team up or becomes the queue they all wait in.
How the DORA metrics have changed since 2014#
The four metrics most people know, deployment frequency, lead time, change fail rate and MTTR, are the 2014 to 2022 version of the model. Nearly every outdated claim about DORA metrics comes from one of the transitions in DORA's own history of the changes, published in January 2026.
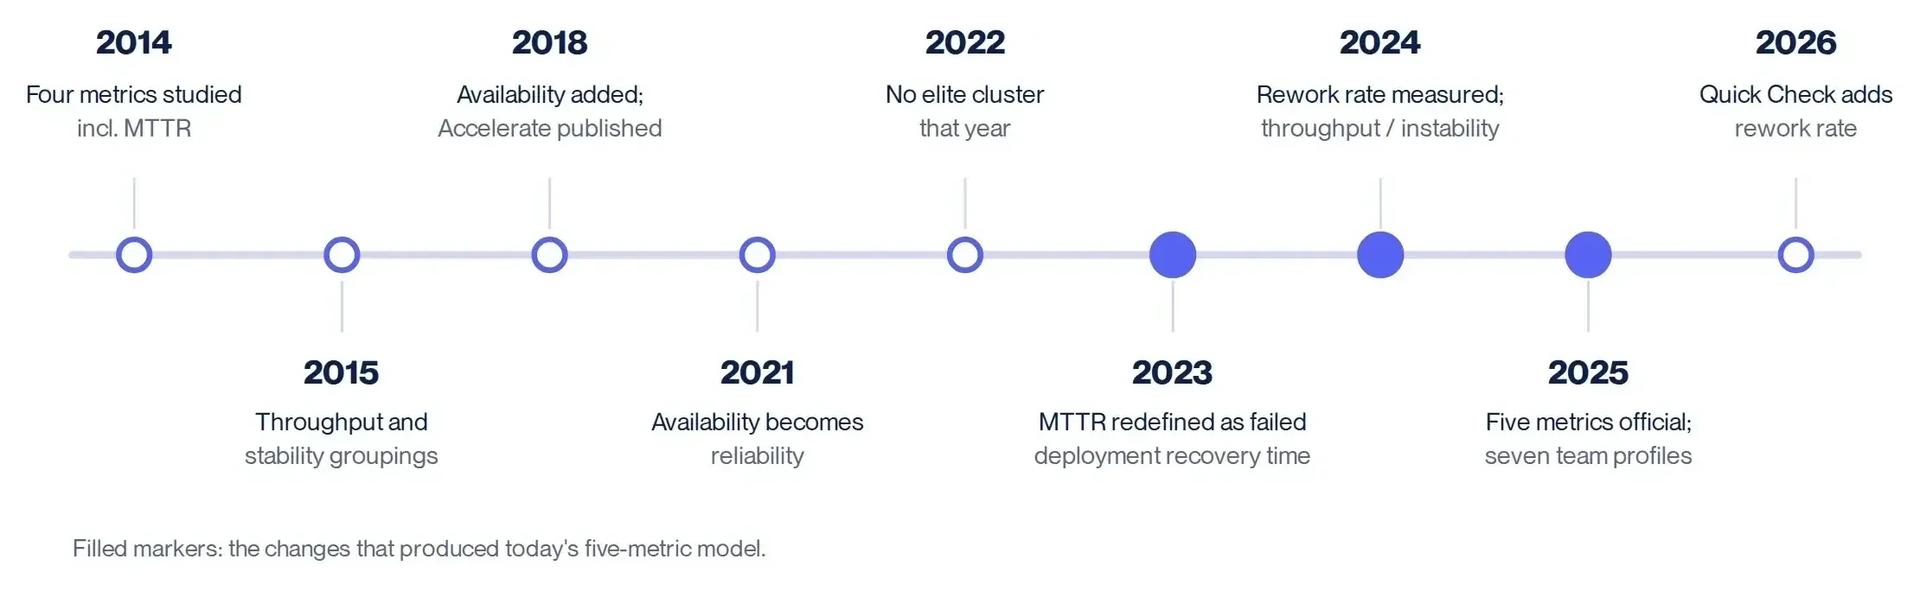
Availability was added in 2018 and broadened to reliability in 2021, in a report DORA now says "inaccurately called the 'reliability' metric the 'fifth metric'". The elite cluster disappeared in 2022 because the top cluster "simply isn't indicating enough of the characteristics of last year's elite cluster". MTTR became failed deployment recovery time in 2023. And the 2024 research measured rework directly, having found change fail rate acting as a proxy for it, which produced the fifth metric confirmed in 2025.
Accelerate (IT Revolution, 2018) still sets out the research behind the metrics and the 24 capabilities that drive delivery performance, and the free DORA Quick Check was updated in April 2026 with rework rate and separate throughput and stability scores. Google's Four Keys project is not a starting point any more: it was archived in January 2024.
Outdated claims to watch for
- "There are four DORA metrics."
- "MTTR is a DORA metric."
- "Reliability is the fifth metric."
- "Stability means change fail rate plus time to restore."
- "Elite teams have a lead time under an hour."
Each of these was true, or was said by DORA, at some point between 2014 and 2023. None describes the current model.
How to start using DORA metrics#
A sequence drawn from DORA's improvement loop and from how we run assessments:
- Choose one service and the team that owns it. DORA metrics are defined per application or service. Starting with one gives you a real baseline and a team that can act on it.
- Agree the definitions and write them down. Settle what counts as a deployment, a failure and rework, where lead time starts, and whether you report medians. The measurement table above lists the decisions.
- Take a baseline. Use the DORA Quick Check for a first reading, then a month or more of real data, collected by hand if necessary. Aim for three to six months of history before judging trends.
- Map the value stream. Draw the path from idea to production with the people involved, including work time and wait time for each step. This is where you find out why the numbers look the way they do.
- Pick one constraint, run an experiment, repeat. State what you are changing, what you expect to happen and which metrics will show it. Watch the instability metrics as guardrails, review the results in retrospectives rather than league tables, and look for the next constraint.
Frequently asked questions#
What are the five DORA metrics?
Change lead time, deployment frequency, failed deployment recovery time, change fail rate and deployment rework rate. The first three measure throughput and the last two measure instability, according to DORA's current guide.
Is MTTR still a DORA metric?
No. DORA redefined mean time to recover as failed deployment recovery time in 2023. The new metric counts only failures caused by deployments, which separates them from outages with external causes.
What is a good deployment frequency?
It depends on the system. In DORA's 2025 survey, 16.2% of respondents deployed on demand and 31.5% between weekly and monthly. The useful comparison is with your own service a quarter ago.
What is the difference between DORA and SPACE metrics?
DORA metrics measure the outcomes of software delivery for a service. SPACE, set out by Forsgren and colleagues in ACM Queue in 2021, is a framework for developer productivity across five dimensions, including satisfaction and collaboration. A team can have strong DORA numbers and a burned-out workforce, which is why DORA's 2025 profiles added burnout and friction to the delivery measures. Many organisations use both.
Do DORA metrics still matter when AI writes most of the code?
They matter more. AI raises output at the keyboard; the DORA metrics show whether that output reaches production faster and more safely. Thoughtworks' April 2026 Radar calls them "more important than ever" in the era of AI-assisted development.