Greening the Grid: How We Helped Reducing The Carbon Footprint with Sustainable Software Practices
This case study explores how re:cinq, a company specialising in sustainable software practices, helped another company optimise their software setup to reduce carbon emissions. Both companies are committed to sustainable practices and share similar values.
Company approached re:cinq after attending a talk about optimising server utilisation at KubeCon in Paris. They recognized the potential for environmental benefits and wanted to improve their setup.

How we did this:
Our methodology is rooted in the research we are doing to reduce Co2 emissions from IT.
We sat down with the Platform team and asked them to walk us through their system. We utilised their analytics system, which in this case was a Prometheus and Grafana setup. The agenda was defined by company, which was a great decision as they know their systems better than anyone and understand the time required to discuss each component. We had the pleasure of working through each environment, the architecture design, as well as the CI/CD pipeline thus, providing opportunities to clarify decisions that were made, as well as understand the key value that each component brings.
As we dove into each component, we could see the signs of a start-up moving into a scale-up. We often notice that when companies make this move, priorities shift (READ). Simply put:
- Startup: do everything as quickly as possible.Try to maintain quality and maintainability, but adding value is the higher priority.In essence, the short-term picture of survival.
- Scaleup: Maintain delivering value, but start focusing on the longer term picture, asking how we scale what we have built, and maintain previous value so that we don't have to spend too much time on it.
In essence, a startup is how you make money, and a scaleup is how you keep making money.
Observations and Recommendations
The goal of the assessment was to see where we could reduce emissions without impacting efficacy. When going through it, we made the following observations.
Properly provision workloads
This is probably something a lot of companies do by default (READ). You set the requested application resources higher in order to mitigate your application “not having enough”. This mindset comes in when we don't have enough information about our applications to set a true value, but we then forget to go back and do proper analysis once we’ve been running our application in the wild.
In order to better facilitate this, and make it easier for engineers to analyse their workloads, we worked with the Platform engineers to create a simple dashboard. The idea is that an engineer has a single space to see what they need to set their resource requests to, simplifying their process and need to analyse.
As an example, the same was done with the Google microservices demo running in our clusters.
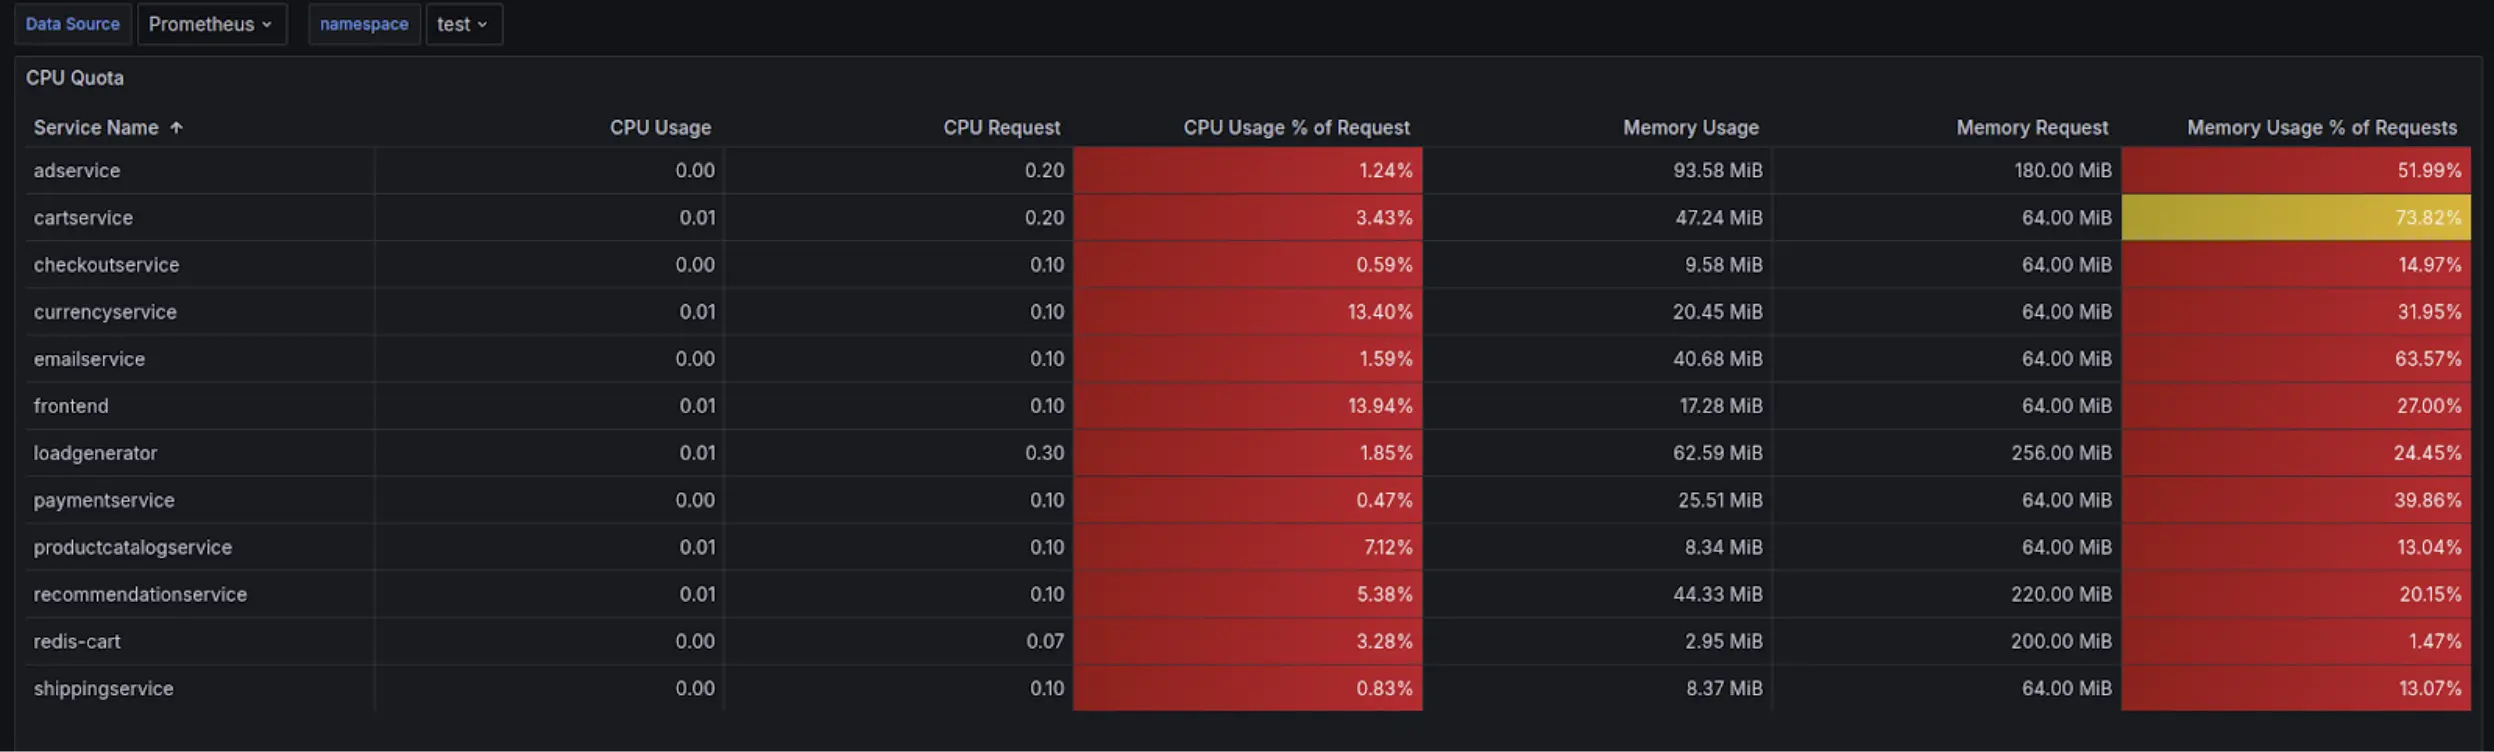
We also added colour coding for when resource requests were within an acceptable range of what the application was utilising.
Keep in mind that this works very well with consistent applications that don’t have a high variability in resource consumption.
Work better with Kubernetes Autoscaling capabilities
This might sound simple in a lot of ways, but Autoscaling Kubernetes requires accounting for spin up times as well as cool down. Spending time to properly calculate your resource requests can help the performance of your Autoscaling capabilities.
Isolate scheduled workloads
Company utilises some intensive time-sensitive scheduled workloads. This meant that resources were scaled up for these workloads, and while they were not running, these resources were idle, consuming energy and emitting emissions. Scheduled workloads come with their own complications, and by moving these to their own dedicated resources, it means they can solve for those complications in isolation, while allowing normal workloads that are consistent and predictable to better utilise resources.
Provide more visibility to engineers on the resources
Enablement is half the battle. Engineers generally want to create better applications, but lacking insights, or having access to insights that they need a lot of time to understand requires effort that can (and generally is) better invested elsewhere. By giving simple, easy to understand dashboards that display engineering changes quickly, makes the feedback loop smaller and empower engineers to solve problems themselves, freeing up time and energy.
Bin packing, how to fit more workloads on node
Kubernetes and containers were built on the idea of co-locating workloads, and Kubernetes does this very well. When analysing your workloads, look at the resource profiles and try to pick nodes where your applications can fit better.
For instance, when starting out we have a tendency to just utilise standard nodes. However if your application is CPU intensive, but does not have a large Memory footprint, you will find that your node's CPU utilisation might be high, but the Memory utilisation is low. In that case, opt for High Performance (CPU optimised nodes).
Testing environments
Testing is important and often the core of development lifecycles. Something that we don't think of is that test environments often run idle when development does not require it and/or development is not happening.For example, on a weekend, very few engineers are working, so you generally have large environments running that can be scaled right down.
Conclusion
The above is not a comprehensive list, but rather some high level suggestions that we found. It was found that company was in a great place technically, and going the extra mile was the next step. The most critical information we found was that by taking the suggested reduction approach, the emissions emitted would go from 967.59* kgCO2eq/month down to 580.55* kgCO2eq/month, completely based on compute.
To put this in perspective, the amount of emissions saved in a month is equivalent to driving a standard petrol car around 1590 KM. Let’s do more of this, at scale.